DiveDeepAI developed a platform that conveys useful information to the client with detailed analysis and visualization of complex data which will help the company to make better decisions.
About Client
A stealth business operating in Canada and USA with a turnover of more than a billion dollars.
The Challenge
Data merging was difficult in few cases where we had to come up with out of the box solutions. In the data visualization, we used plotly which provides interactive graphs, but we couldn’t use plotly dash, so in the end we had to deliver charts in png file format. Name of most of the features were not relevant and data was not cleaned so we had to spend more time on data cleaning and feature engineering.
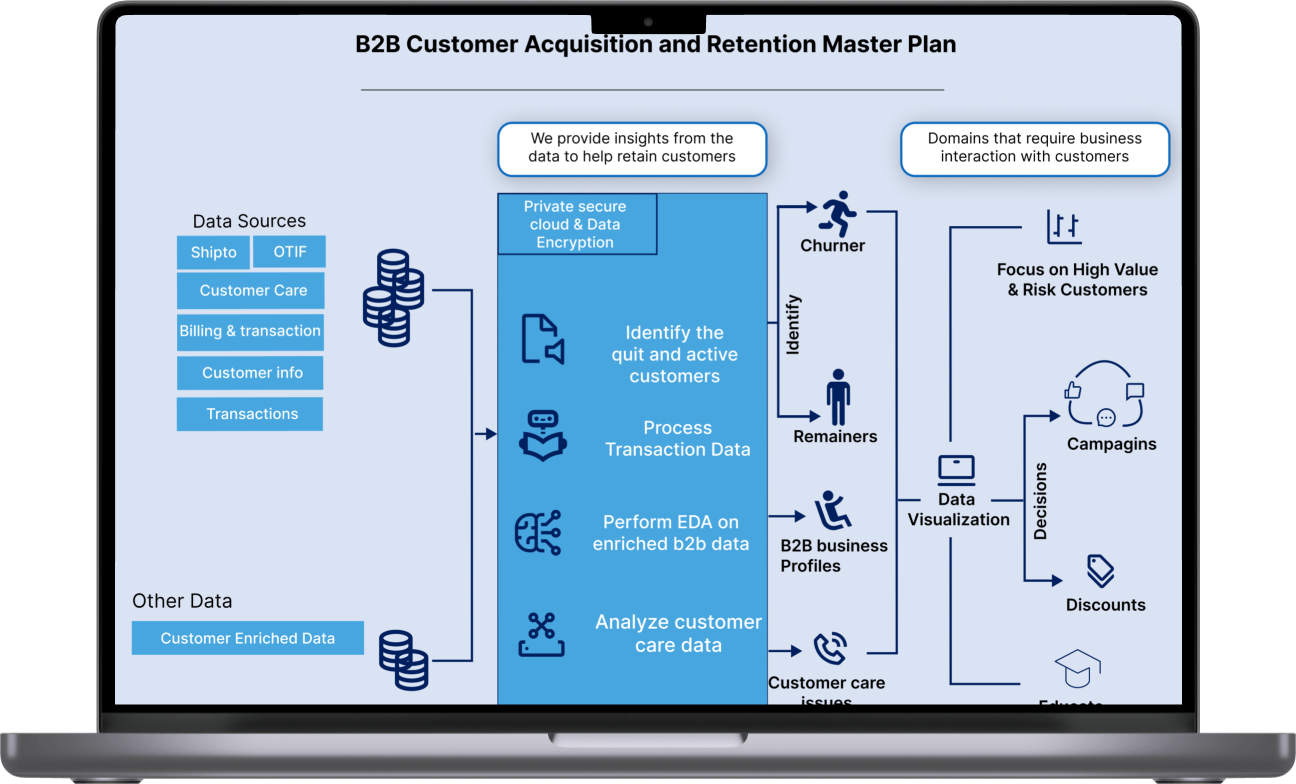
The Solution
In the first phase, we worked on data of residential customers and did segmentation of customers. In the second phase, we calculated and plotted the ratio of active and quitting customers. Different parameters such as price change, age group, gender, length of residence, missed delivery rate, customer service were used to calculate the affecting customer retention and how these will impact the acquisition of customers. Moreover, we plotted several graphs for each analysis and in the end, we provided insights and actions to the executive body of the company.
The Impact
Client would be able to recognize which customer segment is generating more profit and where company is facing downfall. Secondly, company can increase their operations into more demanding regions. It’ll help the client’s company in taking actions which will maximize the profit. Moreover, stakeholders will have a visualization of data which will help them to understand customers behavior.
HIGHLIGHTS
Collects and merges several tables into a single dataset
Provides customer segmentation and lists properties of these groups of customers.
Highlights factors impacting customer retention and acquisition
Provides concise information about customers behavior and pattern by using interactive graphs.
Gives insights and suggests necessary actions to take for the benefit of the company.
Project in Action
Collected data from AWS S3 and Redshift.
Used Collab Working Environment
Data cleaning and data preprocessing using Pandas
Plotted the graphs and charts using Plotly.
Client Testimonial
Amazing Dev! Do not hesitate to hire! Finished the job promptly and made sure all my needs were met!