Customer Churn Prediction
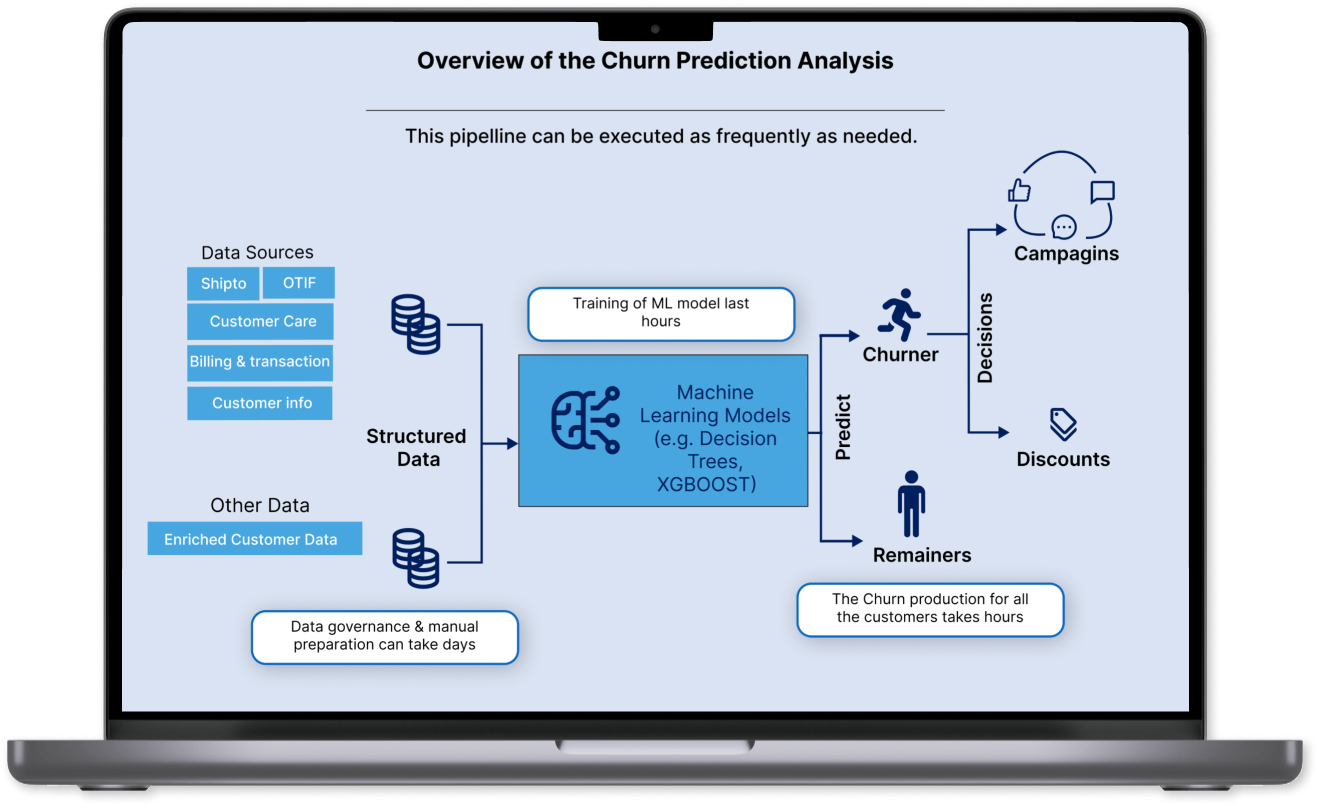
DiveDeepAI developed a platform that helps the company to identify the customers which are more likely to quit the service in the future.


About Client
A water supplying company operating in Canada and USA with turnover more than 2 billion dollars. Company is providing services to both commercial and residential customers.
The Challenge
The initial data was huge, the database consisted of approximately 350 tables, and it was very difficult to merge data into a single dataset. Moreover, few tables had more than 550 million records and our development environment (jupyter notebook and google colab) crashed frequently. Selecting a model for training was a difficult phase. We tested several models to find the best one. Hyper parameters fine tuning took much of the development phase.


The Solution
Project was completed in several phases. Commercial customers were added to the analysis and churn rate was calculated for different categories of customers. Different parameters such as price change, age group, gender, length of residence, missed delivery rate, customer service were used to calculate the affecting customer churn rate. Moreover, a correlation analysis was conducted. A machine learning pipeline was created and trained several machine learning models but Lightgbm outperformed the other algorithms. In the end, threshold was set for several features and highlighted which customers are more likely to quit.
The Impact
The application checks for these features in each card and tells which tests pass and which one fails. If all 8 factors pass the checks then the card is real. Even if one check fails, we call it an error card.

HIGHLIGHTS
- Collects and merges several tables into a single dataset.
- Model will predict the customers which are more likely to quit in the future, so the client can take the necessary actions in time.
- Gives churn rate of customers e.g., which factors are impacting customers to leave.
- Provides concise information about customers behaviours and pattern by using interactive graphs.
Project in Action
Data Collection
from AWS S3 and Redshift.
Used Collab Working Environment
Did the data analysis
Did the data analysis